Working with Census Data to Analyze Commuter Trends
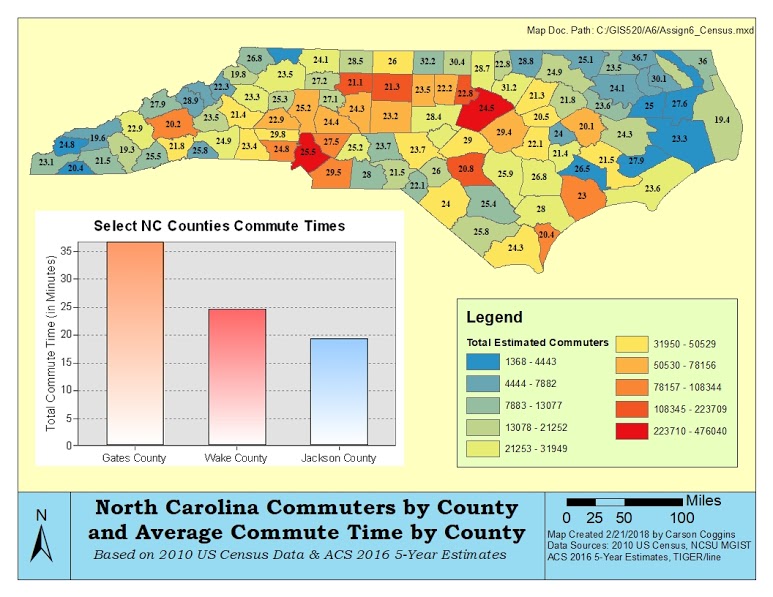
Problem: The request for this project is to create a Thematic Map for the NC Department of Human Resources using tabular Census data, which will require the selection, manipulation, and eventual joining of tabular data accessed through the US Census Fact Finder to US Census geographic TIGER/Line shapefiles.
Analysis Procedures: The Census data table utilized to generate the map is compiled from the American Community Survey 5-year Estimates. This data was collected between 2012 and 2016 in efforts to understand important factors in American communities, focusing particularly on commuting rates by gender. The two fields from this csv table I utilized in this project are ‘HC01_EST_VC55 – Total; Estimate; TRAVEL TIME TO WORK – Mean travel time to work (minutes)’, and ‘HC01_EST_VC32 – Total; Estimate; Workers 16 years and over who did not work at home’. I used the total number of Workers over 16 who did not work from home (a/k/a workers who commute) to display the number of commuters per County in NC, and the Average Travel Time to Work as a label for each County as well as a graph showing the high, median, and low travel time values.
Strategies involved in solving this problem included tabular and spatial data joins, understanding and interpretation of Census data tables and visualization of statistical data across different levels of geographic units. I began with brainstorming what kind of visualization or map I wanted to create. I knew that Tabular Census data can be very detailed and specific, so I knew I would need to filter out unnecessary records to adequately display the topic in map form. The next step was locating and downloading the tabular data needed from the US Census Fact Finder page. During this process the information can be filtered by topic and geography; I narrowed the search parameters by indicating that I only wanted data at the County level for the State of North Carolina. Once I selected the tabular data and decided which time period and geographic area the project will focus on, I then downloaded the matching TIGER/Line shapefile for that geographic area.
Once I downloaded all the tabular and spatial data, I prepared the data tables for the eventual join with the TIGER shapefile to ensure my final map product was effective. Finally, I executed the join by using a County ID field from within the tabular Census data to join with County ID field of matching type and length in the TIGER/Line shapefile of NC Counties as decided by the 2010 US Census.
Results:
Reflection: The work undertaken to solve this problem demonstrates why it is so important for GIS Professionals to be familiar with spatial and non-spatial data in visualizing statistics across space. Manipulation of tabular data is required to map anything other than Geographic Boundaries and whatever attributes are given with shapefiles/Feature Classes. There are a myriad of applications for the concepts utilized in this assignment; the basis of any thematic map relies upon the ability to join spatial data with different types of tabular information and make decisions regarding the classification of such data so a map is clear and organized in making its intended point.
LIDAR Time-Series Modeling of Coastal Change in Cape Lookout NC
Problem: Understanding how coastlines and barrier islands are shaped and impacted by sea level rise, increased frequency of strong storms, and other natural and man-made factors, remains a vital undertaking in the scientific community. As we continue to populate coastal areas that are under threat of change in sea level, there is a pressing need to collect and examine data detailing how coastline and barrier islands have changed. Using high-density lidar point cloud data from multiple years, this project follows the methods and workflow outlined in the work ‘GIS-based Analysis of Coastal Lidar Time-Series’ by Hardin, Mitasova, Tateosian, and Overton, to identify spatial patterns through the examination of lidar time-series data for Cape Lookout of North Carolina.
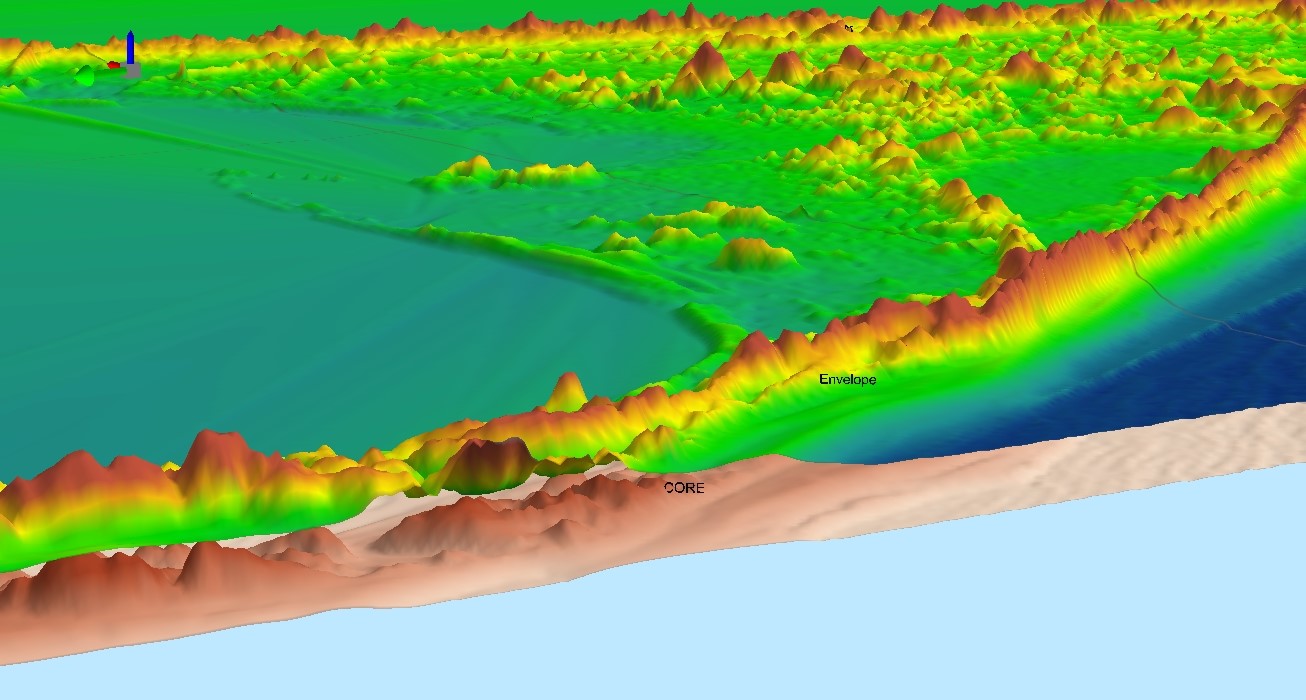
Analysis Procedures: To truly leverage the output of a Time Series analysis we wanted to examine the core and envelope surfaces, which bound terrain evolution within the study period. Put more simply, we want to view the areas of Cape Lookout that were constant throughout our study period alongside those which varied over time. The core surface is generated through the minimum elevation across the study period while the envelope represents the max elevation across the study period.
The first image in the results section below depicts the 3D visualization as well as a cross section view of the core and envelope. The 3D image depicts the core and envelope with z=3 to effectively display the surfaces. Another key piece of analysis relies on the 3D Visualization of Historic Shoreline Contour Lines.
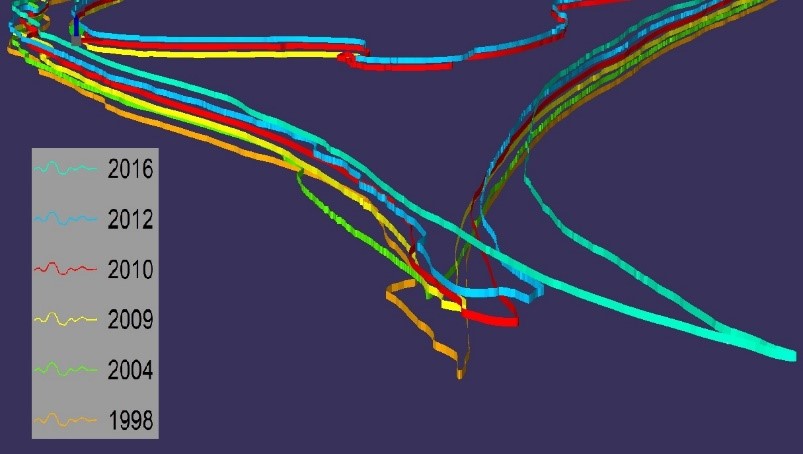
The second image below was generated based on a historic shoreline feature dataset produced by the North Carolina Department of Environmental Quality (NCDEQ). These shoreline features include shoreline outside our study area, but they provide a far more detailed and clear view of how the lidar-based contour shorelines shifted from year to year. The NCDEQ line features are derived from lidar and orthophotos from 1998, 2004, 2009, 2010, 2012, and 2016. After filtering the features to the desired time range and general study area, we exported each year individually and displayed them in ArcScene using z-factor offsets spanning 0 to 500 and extrusion factors of 100. This process improves the ability for visual inspection of changing coastal features from a 2-dimensional overlay of contour shoreline features, and clearly delineates each year’s shoreline features from the rest.
Results:
Reflection: The results of our work indicate there is a significant amount of change occurring on Cape Lookout over time, both in elevation and in shoreline position. We were able to capture the Eastern directional shift of Cape Lookout Shoals across our study period, as well as the increase in elevation values along the Southwest and Southeast-facing coastlines. Working with lidar data to study these changes in Cape Lookout provided an excellent opportunity to explore how lidar and remotely sensed data can be processed and leveraged. This knowledge and use of lidar is not limited to coastal areas either. For example, it can be used to study mountain range elevation change, generate 3D models of real-world objects like buildings, or even map and model archeological sites.
